The plunge from 75.01 is impulsive and the bounce at 67.42 was followed by sideways action. Elliott Wave Theory tells us that - even if this count is completely rubbish - we can at least expect another impulsive move down.
There is a possibility that this goes down in 3 waves, double or triple "zig-zagging" in a larger degree wave 4. In that case this correction is a smaller wave B.
Key is 75.01, this level should hold before the next leg down. Personally I would like this stock to go somewhat higher towards 75.01 before it drops from a r/r perspective.
Sunday, October 2, 2016
Wednesday, September 28, 2016
KO - Coke doesn't look that safe anymore
Coca Cola is typically seen as a safe haven stock and it's allegedly even Warren Buffett's favorite stock but a glance on the chart suggests that a top is near. Now, picking the top of a 50 year plus up-trend is challenging to say the least but a smaller degree impulsive move down preferably breaking the trendline and a correction up would be very telling and a nice short opportunity in my view.
It looks like Coke is nicely following the Elliott Wave textbook, wave 3 is a large spike followed by a slow motion move down (wave 4) and we are now in a slow but impulsive rally (relatively to wave 3). Within this larger degree wave 5 there are 5 smaller degree waves but the stock can extend from here and in that case the move from 36.56 is just a smaller degree wave 1. Put this one on your watchlist.
Sunday, September 25, 2016
ABBV - AbbVie points south
AbbVie made a top in July 2015 at 71.51 and broke quickly to the downside in 5 waves to 45.45. Then, from Oktober 2015 until August 2016 the stock was clearly in a correction and 71.51 was never threatened.
Later Abbvie turned south at 68.12 and made another (smaller degree) 5-wave decline to 63.06 and we are now correcting this impulsive move down.
According to the Elliott Wave Principle we can now expect that the stock will turn and make another leg down before it reaches 68.12, If we end up above this level this count is invalid.
Tuesday, August 2, 2016
DJIA - Dow Jones Industrial Average since 1900
Let's go back to the previous depression in the thirties of the last century. The Dow plunged like there was no tomorrow until 1942 before a massive rally initiated which already ensured 74 years of gains.
Clearly, the rally is unfolding as a 5-wave advance and we are now in the last stages of the creation of this pattern. Still more gains are expected because the fifth wave which started in 2009 is not yet complete.
However when this pattern is complete a deep sell-off can be expected. Compared with the 2007/2008 plunge the upcoming decline in price should be deeper and more time-consuming. So if you think we live in turbulent times these days I think we ain't see nothing yet !
But first we will see higher grounds, to continue the uptrend price should stay above 17063.
Since 1900:
Since 2009:
SPX500 - Due for a correction
As long as SPX stays above 1990 I'm bullish but a correction seems likely from here now . Wave 5 of minor wave 1 barely stuck it's head out above the extreme of minor wave 3 but I count 5 waves up so I reckon wave 1 (of wave 3) is complete. If this plays out a great opportunity will present itself to catch wave 3 of wave 3 which should be fast and furious.
Big picture : http://elliottwavestructures.blogspot.be/2016/06/s-more-upside-to-come.html
Friday, July 29, 2016
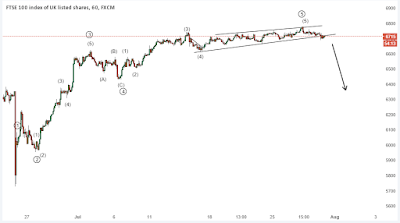
FTSE - Poised for a downturn
After the Brexit referendum vote the FTSE rallied fiercely in 5 waves to 6780. Wave 5 unfolded as an ending diagonal which confirms the 5-wave pattern is about to end. A drop seems imminent.
Wednesday, July 13, 2016
JBLU - JetBlue, completion of wave 4 is confirmed, bullish
Wave 4 of JBLU ended at 14.75 after which it surged through the 8 months old trendline. We are now in a minor wave 4 which ideally ends at 17.50, the 38.2 retracement of wave 3.
Monday, July 4, 2016
TESO - Tesco poised for a rally
The plunge from 36.70 to 5.10 has unfolded in 3 waves. However, wave (c) didn't exceed the extreme of wave (a) so after a correction there is still the possibility that wave (c) will extend. This stock is close to zero so there is not much room to extend. Either way, a rally from here to 12 is likely.
Wednesday, June 29, 2016
S&P - More upside to come
In what looks like an expanded flat wave 2 completed at 1990 which suggests the S&P has still a long way to go to the upside. I think all the price action starting from 2009 is a larger wave 5 so when the pattern completes in a few years multiple years of decline will follow.
Subscribe to:
Posts (Atom)


